Security and Observability for Cloud Native Platforms Part 3
Security and Observability for Cloud Native Platforms Part 1
Security and Observability for Cloud Native Platforms Part 2
Security Monitoring and Observability
Monitoring and observability are essential for Kubernetes runtime security, i.e., protection of containers (or pods) against active threats once the containers are running.
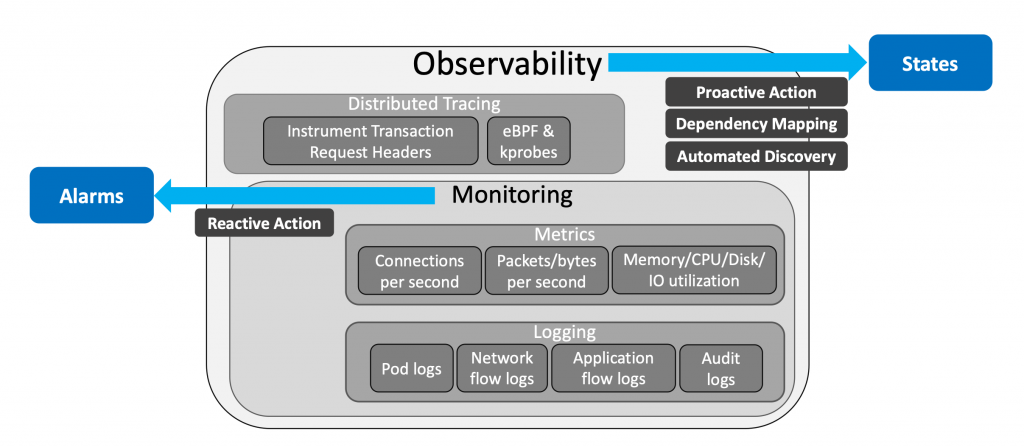
Monitoring is a predefined set of measurements in a system that are employed to detect the deviations from a normal range. Kubernetes can monitor a variety of data types (Pod logs, Network flow logs, Application flow logs and Audit logs) and metrics (Connections per second, Packets per second, Application requests per second and CPU and memory utilization). These logs and metrics are utilized to identify known failures and provide detailed information to resolve the issue.
An observability system provides insights about the internal state of an entity in the Kubernetes cluster. Such insights and the contexts about the events are the main difference between observability and monitoring. To do so, an observability system must be built on top of the monitoring elements in the Kubernetes cluster, and it must collect data and metrics at a deployment-level or service-level granularity, to deliver an accurate representation of the state of the deployment or service in the Kubernetes cluster. This is unlike the monitoring systems that collect and report data and metrics at a pod-level granularity and lack aggregated information and insights.
An observability system should be able to determine the deployment, the replica set, and the service of a given pod, and it should recognize the importance of the pod to its corresponding service or deployment. Providing such context can be valuable in making decisions in response to events reported from a particular pod.

There are several challenges in gaining insights with deployment-level or service-level granularity, particularly in a microservices-based application deployment in Kubernetes cluster. Some of these challenges include the asynchronous communication between microservice, and the fact that each microservice can serve several independent applications.
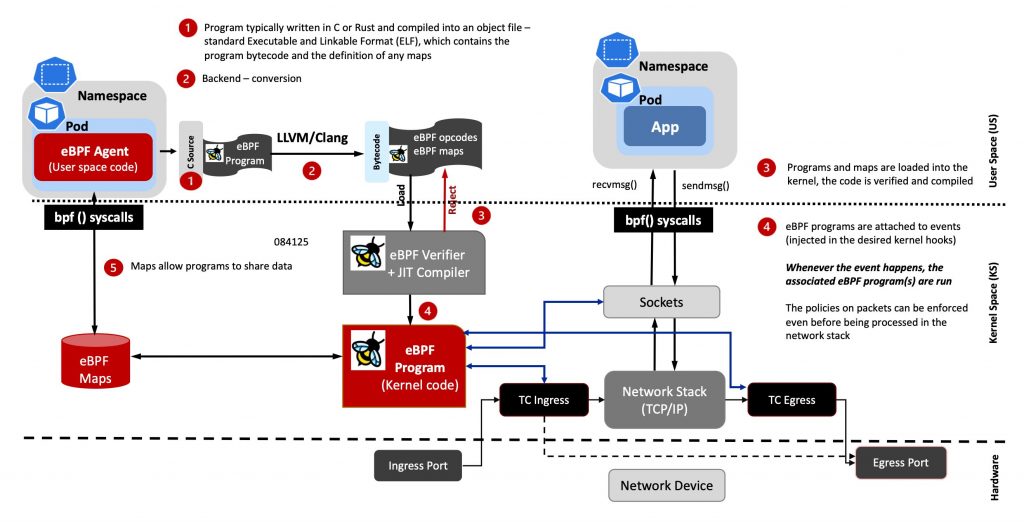
The extended Berkeley Packet Filter (eBPF) allows you to monitor and build rich observability from infrastructure to applications. It let you run custom code in the kernel when the kernel or an application passes a certain hook point (system call, function entry/exit, kernel trace point, network event, etc.), as depicted in the figure below.

Running eBPF programs is possible using a set of eBPF hooks that are supported in the networking stack of the Linux kernel. Higher level networking constructs can be created by combining these hooks:
- Express Data Path (XDP): The networking driver is the earliest point where it is possible to attach the XDP BPF hook. And when a packet is received, the eBPF program is triggered to run.
- Traffic Control Ingress/Egress: Like XDP, by hooking the eBPF programs to the traffic control ingress, they are attached to a networking interface. The difference with XDP is that the eBPF program will run after the initial processing of the packet by the networking stack.
- Socket operations: Another set of hooking points are the socket operations hook that attach the eBPF program to a specific cgroup and triggers them based on TPC events.
- Socket send/recv: The socket send/recv hook triggers and runs the attached eBPF programs on every send operation performed by a TCP socket.
The eBPF Maps enable eBPF to share acquired information and preserve state. As a result, eBPF programs can utilise the eBPF Maps to maintain and retrieve data in a variety of data formats. The eBPF Maps can be accessed through a system call from both eBPF programs and user-space applications. Hash tables, Arrays; LRU (Least Recently Used); Ring Buffer; Stack Trace and LPM (Longest Prefix Match) are examples of support maps.
Generally, the eBPF program is written in C or Rust and compiled as an object file. This is a standard Executable and Linkable Format (ELF) file that can be analyzed using tools such as readelf and it comprises both the program’s bytecode and the definition of any maps.
As illustrated in the figure above, when an eBPF program is loaded into the kernel, it will be triggered by an event (system call, in the figure). Once the event occurs, the attached eBPF program(s) will be executed.
There is a broad variety of events that you can attach the eBPF programs. This enables the eBPF programs to be utilized for efficient monitoring and observability functionalities, such as threat defence and intrusion detection.


